
Page 14 - CARILEC Electricity Tariff - September 2021
P. 14
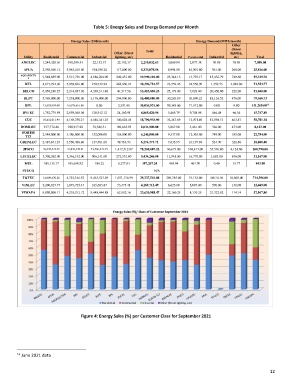
Table 5: Energy Sales and Energy Demand per Month

                               Energy Sales (US$/month)                            Energy Demand (MWh/month)
                                                                                                  Other
                                                                                                  (Street
                                                              Total
                                                 Other (Street                                   lighting,
           Utility   Residential   Commercial   Industrial   lighting, etc)   Residential   Commercial   Industrial   etc)   Total
          ANGLEC   1,244,328.36   930,399.53   22,152.37   22,152.37   2,219,032.63   3,969.84   2,977.38   70.89   70.89   7,089.00
           APUA    2,958,560.12   5,063,410.60   194,108.24   117,000.00   8,333,078.96   8,994.00   16,001.00   561.00   260.00   25,816.00
          AQUALECTR  9,540,659.00   5,513,736.00   4,686,264.00   249,451.00   19,990,110.00   25,344.13   13,793.17   15,432.79   749.68   55,319.76
             A
            BEL    4,617,792.66   5,039,626.00   270,732.24   468,630.67   10,396,781.57   23,552.45   24,558.99   1,359.53   2,082.80   51,553.77
          BELCO    6,859,230.25   2,214,837.02   4,338,311.40   41,517.56   13,453,896.23   25,179.00   7,829.00   20,450.00   222.00   53,680.00
           BLPC    5,769,000.00   7,291,000.00   3,176,000.00   244,000.00   16,480,000.00   30,283.89   30,690.23   18,116.52   476.09   79,566.73
                                                                                                                16
            BPL    13,955,954.00   16,078,616.00   0.00   2,351.00   30,036,921.00   59,348.00   71,912.00   0.00   9.00   131,269.00
           BVI EC   1,752,779.89   2,959,568.04   128,912.12   24,160.91   4,865,420.96   5,468.79   9,748.08   464.48   66.54   15,747.89
           CUC     10,432,013.99   4,169,750.21   4,048,341.25   140,828.45   18,790,933.90   33,247.89   12,071.69   12,998.13   463.47   58,781.18
          DOMLEC   917,772.46   928,917.88   78,546.51   109,663.95   2,034,900.80   3,867.00   3,461.00   326.00   473.00   8,127.00
          FORTIS   2,584,000.00   3,386,000.00   152,000.00   124,000.00   6,246,000.00   9,337.00   12,303.00   789.00   355.00   22,784.00
            TCI
         GRENLEC   2,487,641.24   3,550,488.86   137,481.68   98,763.93   6,274,375.71   7,635.95   10,197.69   524.90   321.86   18,680.40
           JPSCO   32,445,472.49   31,839,449.21   12,566,573.45   1,417,512.07   78,269,007.22   96,673.00   104,417.00   55,576.00   4,124.00   260,790.00
          LUCELEC   3,308,362.00   5,346,192.00   506,141.00   273,551.00   9,434,246.00   11,948.00   16,770.00   1,603.00   846.00   31,167.00
           MUL     195,135.17   195,658.82   196.22   6,277.03   397,267.24   465.94   461.70   0.49   15.77   943.90
           STUCO                                                 N/A
          T&TEC    14,009,670.28   4,723,166.52   9,433,527.29   1,071,176.99   29,237,541.08   289,745.00   73,133.00   340,711.00   10,805.00   714,394.00
          VINLEC   2,200,827.77   1,849,725.44   185,683.87   53,475.41   4,289,712.49   6,623.00   5,087.00   598.00   141.00   12,449.00
          VIWAPA   9,890,008.11   4,218,572.72   9,449,444.88   62,962.76   23,620,988.47   22,760.25   8,770.25   21,322.62   114.74   52,967.86


                                   Figure 4: Energy Sales (%) per Customer Class for September 2021


        16  June 2021 data


                                                                                                                  12