
Page 19 - CARILEC Tariff Survey Report June 2023
P. 19
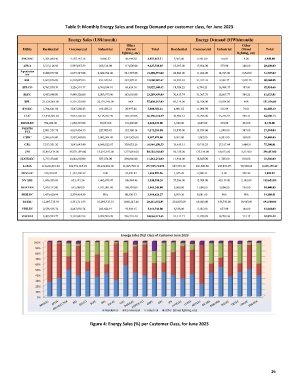
Table 9: Monthly Energy Sales and Energy Demand per customer class, for June 2023

                              Energy Sales (US$/month)                             Energy Demand (MWh/month)
                                                      Other                                           Other
           Utility   Residential   Commercial   Industrial   (Street   Total   Residential   Commercial   Industrial   (Street   Total
                                                    lighting, etc)                                  lighting, etc)
          ANGLEC   1,204,880.40   3,155,145.16   8,986.27   46,449.28   4,415,461.11   2,362.00   6,461.00   16.00   9.00   8,848.00
           APUA    3,313,126.96   5,997,067.89   200,514.00   117,000.00   9,627,708.85   10,097.00   17,694.00   579.00   260.00   28,630.00
          Aqualectra   9,480,677.00   4,673,547.00   4,602,764.00   541,387.00   19,298,375.00   24,506.00   11,282.00   14,325.00   1,634.00   51,747.00
            NV
           BEL     4,669,676.89   6,467,625.83   481,349.64   442,295.31   12,060,947.67   23,824.22   31,317.33   2,936.77   1,965.76   60,044.08
          BELCO    8,767,070.39   3,226,591.77   6,760,054.10   68,624.16   18,822,340.42   18,924.22   6,794.25   16,988.37   187.83   42,894.66
           BLPC    8,453,848.00   9,448,528.00   5,203,973.00   183,650.00   23,289,999.00   30,413.74   31,367.33   18,867.77   384.21   81,033.05
           BPL     23,525,065.00   9,107,103.00   22,797,995.00   N/A   55,430,163.00   69,174.00   22,928.00   59,834.00   N/A   151,936.00
          BVI EC   1,764,841.02   3,847,288.43   165,433.21   30,997.48   5,808,560.14   4,801.52   11,094.98   515.89   76.01   16,488.40
           CUC     14,916,691.84   5,972,108.20   5,115,767.49   192,107.06   26,196,674.59   36,502.33   13,796.96   13,276.53   504.31   64,080.13
          DOMLEC   954,264.00   1,058,593.00   70,953.00   118,466.00   2,202,276.00   3,742.00   3,669.00   274.00   454.00   8,139.00
          FORTIS   2,801,527.78   4,010,454.15   227,905.81   132,368.14   7,172,255.88   10,870.00   15,039.00   1,098.00   387.00   27,394.00
           TCI
           GBPC    2,986,616.00   2,552,569.00   2,002,964.00   1,544,929.00   9,087,078.00   9,563.00   7,962.00   6,597.00   358.00   24,480.00
           GPL     7,533,351.20   3,043,643.40   6,048,522.67   338,633.26   16,964,150.53   35,619.51   10,718.25   27,517.44   1,484.81   75,340.01
           JPS     32,891,374.00   35,571,594.00   15,012,542.00   1,227,048.00   84,702,558.00   98,135.00   125,134.00   69,872.00   3,312.00   296,453.00
          LUCELEC   3,737,474.00   6,642,658.00   587,274.00   294,866.00   11,262,272.00   11,934.00   18,849.00   1,705.00   818.00   33,306.00
           LUMA   113,666,819.24   122,791,065.23   29,632,281.00   11,495,599.11   277,585,764.58   647,391.18   666,289.88   145,893.93   30,580.24   1,490,155.23
          NEVLEC   379,760.85   1,142,400.27   0.00   94,648.84   1,616,809.96   1,945.28   2,900.33   0.00   250.26   5,095.87
          NV EBS   1,696,939.86   653,191.56   1,463,878.47   106,984.46   3,920,994.35   57,586.00   15,704.00   40,159.00   2,182.00   115,631.00
          ROATAN   2,049,312.00   643,498.00   1,011,981.00   100,454.00   3,805,245.00   5,600.00   1,600.00   3,000.00   240.00   10,440.00
          SKELEC   1,459,620.94   2,374,454.80   N/A   80,550.53   3,914,626.27   6,099.30   8,081.60   N/A   N/A   14,180.91
          T&TEC    12,607,715.59   4,391,711.95   10,093,517.91   1,088,147.40   28,181,092.85   254,807.00   69,040.00   359,750.00   10,943.00   694,540.00
          VINLEC   2,558,958.72   2,247,856.74   245,622.19   59,306.15   5,111,743.80   6,518.00   5,325.00   657.00   144.00   12,644.00
          VIWAPA   9,303,524.77   5,101,824.99   9,072,503.29   586,718.40   24,064,571.45   21,141.17   11,250.92   19,789.36   714.15   52,895.59


                                       Figure 4: Energy Sales (%) per Customer Class, for June 2023


                                                                                                                  16