
Page 19 - CARILEC Tariff Survey Results June 2022
P. 19
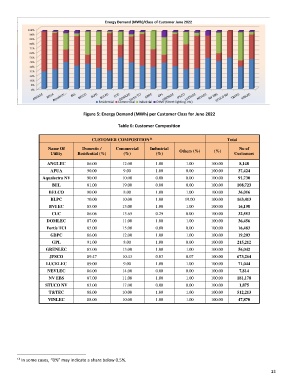
Figure 5: Energy Demand (MWh) per Customer Class for June 2022

                                                  Table 6: Customer Composition

                                       CUSTOMER COMPOSITION                                     Total
                                                               14
                     Name Of       Domestic /      Commercial   Industrial   Others (%)     (%)      No of
                      Utility    Residential (%)     (%)          (%)                              Customers

                     ANGLEC          86.00          12.00         1.00         1.00      100.00      8,148
                      APUA           90.00           9.00         1.00         0.00      100.00      37,424
                   Aqualectra NV     90.00          10.00         0.00         0.00      100.00      91,730
                       BEL           81.00          19.00         0.00         0.00      100.00     108,723
                     BELCO           90.00           8.00         1.00         1.00      100.00      36,016
                      BLPC           70.00          10.00         1.00        19.00      100.00     163,413
                      BVI EC         85.00          13.00         1.00         1.00      100.00      16,198
                       CUC           86.06          13.65         0.29         0.00      100.00      32,553
                     DOMLEC          87.00          11.00         1.00         1.00      100.00      36,456
                    Fortis TCI       85.00          15.00         0.00         0.00      100.00      16,483
                      GBPC           86.00          12.00         1.00         1.00      100.00      19,203
                       GPL           91.00           8.00         1.00         0.00      100.00     215,212
                    GRENLEC          85.00          13.00         1.00         1.00      100.00      56,042
                      JPSCO          89.47          10.43         0.03         0.07      100.00     673,264
                    LUCELEC          89.00           9.00         1.00         1.00      100.00      71,044
                     NEVLEC          86.00          14.00         0.00         0.00      100.00      7,814
                     NV EBS          87.00          11.00         1.00         1.00      100.00     181,178
                    STUCO NV         83.00          17.00         0.00         0.00      100.00      1,875
                     T&TEC           88.00          10.00         1.00         1.00      100.00     512,213
                     VINLEC          88.00          10.00         1.00         1.00      100.00      47,870


        14  In some cases, “0%” may indicate a share below 0.5%.

                                                                                                                  13