
Page 33 - CARILEC CE Industry Journal_Oct_2019
P. 33
TURBINE POWER OUTPUT
Innovation Trends
The renewable energy market is growing globally,
including Canada. Turbine manufacturers have been
pushing for continuous innovation due to increased
competitiveness in the wind power industry. On the other
hand, there are challenges to these innovation trends.
Taller towers cost more because of greater weight.
Figure 3 - Global Capacity Factor of Onshore Wind Trend
P=C_p ρ A V^3
Equation 2
PART TWO
ρ = Density of air
Cp = Power Coefficient (Bentz limit of 0.593) Canadian Wind Sector
A = Rotor swept area
V = Wind speed In 2017, Canada added 341 MW of wind capacity,
representing approximately $800 million of investment.
Equation 2 shows the relationship between power, the Canada finished the year with a total 12,239 MW of wind
area intercepting the wind, and the wind speed (Bagchi, energy capacity. This equates to 6% of the country’s
2016). This equation proves that the larger the swept electricity demand and enough to power over 3 million
area, the greater the power. Meaning, the larger the homes (canwea, 2018).
turbine, the greater the power. Bigger turbines cover a
wide swept area that increases it’s capacity. Increasing There are a few reasons why the global market has become
wind power can also be done by building turbines higher more favourable for wind developers (IRENA, 2018). This
into the atmosphere where the wind blows steady. This includes a steady cost decline of wind technology (due to
increases the capacity factor (Roberts, 2018). market competition), low commodity prices, greater supply
chain competition, manufacturing economies of scale, and
Figure 2 shows the evolution of wind turbine rotor process improvements (BNEF, 2018).
diameter between 1995-2015. This demonstrates a
trend towards larger turbines and wind towers with greater
swept areas. Within seven years, the rotor diameter of
turbines for newly commissioned projects increased.
Canada increased by 47%, and the United States by
22%. Canada and the US increased their rotor diameters
quicker than the nameplate capacity of a turbine.
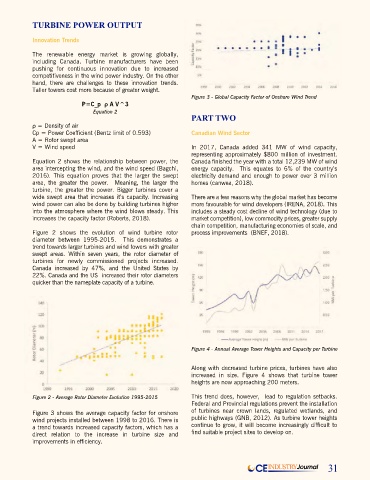
Figure 4 - Annual Average Tower Heights and Capacity per Turbine
Along with decreased turbine prices, turbines have also
increased in size. Figure 4 shows that turbine tower
heights are now approaching 200 meters.
Figure 2 - Average Rotor Diameter Evolution 1995-2015 This trend does, however, lead to regulation setbacks.
Federal and Provincial regulations prevent the installation
Figure 3 shows the average capacity factor for onshore of turbines near crown lands, regulated wetlands, and
wind projects installed between 1998 to 2016. There is public highways (GNB, 2012). As turbine tower heights
a trend towards increased capacity factors, which has a continue to grow, it will become increasingly difficult to
direct relation to the increase in turbine size and find suitable project sites to develop on.
improvements in efficiency.
CE INDUSTRY Journal 31