
Page 32 - CARILEC CE Industry Journal_Oct_2019
P. 32
ABSTRACT
Is there value in implementing taller turbines in wind farms?
Is there a trend in Canadian wind farms?
Is there a limit at which turbine height no longer affects cost dynamics?
Yes, to all the above.
In the report at hand, we demonstrate how economies of scale impact long-run costs in operating a wind farm and
competitiveness of utilizing taller turbines in energy auctions. Furthermore, comparing data for more than 280 wind farms
in Canada over 25 years demonstrates that over time, the heights of wind turbines have increased along with the capacity
in megawatts per turbine. That is, to say a turbine installed in 2017 is equivalent to four turbines installed in 2003.
PART ONE
LCOE Metric and PPA Pricing
The Levelized Cost of Energy (LCOE) is an economic
assessment. It’s the average total cost to build and
operate a power-generating system, divided by the total
power generated over its lifetime (Bruck, Sandborn, &
Goudarzi, 2018). LCOE is the minimum price to sell
energy for a project to break even (NREL, 2018).
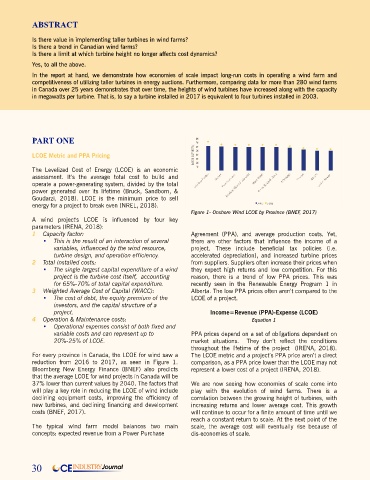
Figure 1- Onshore Wind LCOE by Province (BNEF, 2017)
A wind project's LCOE is influenced by four key
parameters (IRENA, 2018):
1 Capacity factor: Agreement (PPA), and average production costs. Yet,
• This is the result of an interaction of several there are other factors that influence the income of a
variables, influenced by the wind resource, project. These include beneficial tax policies (i.e.
turbine design, and operation efficiency. accelerated depreciation), and increased turbine prices
2 Total installed costs: from suppliers. Suppliers often increase their prices when
• The single largest capital expenditure of a wind they expect high returns and low competition. For this
project is the turbine cost itself, accounting reason, there is a trend of low PPA prices. This was
for 65%-70% of total capital expenditure. recently seen in the Renewable Energy Program 1 in
3 Weighted Average Cost of Capital (WACC): Alberta. The low PPA prices often aren’t compared to the
• The cost of debt, the equity premium of the LCOE of a project.
investors, and the capital structure of a
project. Income=Revenue (PPA)-Expense (LCOE)
4 Operation & Maintenance costs: Equation 1
• Operational expenses consist of both fixed and
variable costs and can represent up to PPA prices depend on a set of obligations dependent on
20%-25% of LCOE. market situations. They don’t reflect the conditions
throughout the lifetime of the project (IRENA, 2018).
For every province in Canada, the LCOE for wind saw a The LCOE metric and a project’s PPA price aren’t a direct
reduction from 2016 to 2017, as seen in Figure 1. comparison, as a PPA price lower than the LCOE may not
Bloomberg New Energy Finance (BNEF) also predicts represent a lower cost of a project (IRENA, 2018).
that the average LCOE for wind projects in Canada will be
37% lower than current values by 2040. The factors that We are now seeing how economies of scale come into
will play a key role in reducing the LCOE of wind include play with the evolution of wind farms. There is a
declining equipment costs, improving the efficiency of correlation between the growing height of turbines, with
new turbines, and declining financing and development increasing returns and lower average cost. This growth
costs (BNEF, 2017). will continue to occur for a finite amount of time until we
reach a constant return to scale. At the next point of the
The typical wind farm model balances two main scale, the average cost will eventually rise because of
concepts: expected revenue from a Power Purchase dis-economies of scale.
30 CE INDUSTRY Journal