
Page 34 - CARILEC CE Industry Journal_Oct_2019
P. 34
PART THREE The advantages of large scale production that result in
lower unit (average) costs (cost per unit)
Economics of Scale
Formula:
AC = TC / Q
Economies of scale is an economic term that refers to the AC = Average Cost
cost advantages achieved by an expansion in operations. As TC = Total Cost
total output increases, fixed operational costs are set across Q = Quantity
more items, leading to a reduction in the cost per unit.
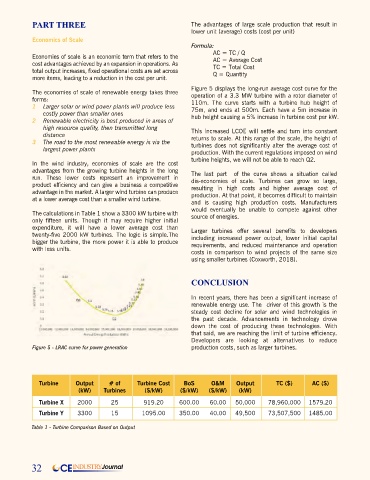
Figure 5 displays the long-run average cost curve for the
The economies of scale of renewable energy takes three operation of a 3.3 MW turbine with a rotor diameter of
forms: 110m. The curve starts with a turbine hub height of
1 Larger solar or wind power plants will produce less 75m, and ends at 500m. Each have a 5m increase in
costly power than smaller ones hub height causing a 5% increase in turbine cost per kW.
2 Renewable electricity is best produced in areas of
high resource quality, then transmitted long This increased LCOE will settle and turn into constant
distance
3 The road to the most renewable energy is via the returns to scale. At this range of the scale, the height of
turbines does not significantly alter the average cost of
largest power plants production. With the current regulations imposed on wind
turbine heights, we will not be able to reach Q2.
In the wind industry, economies of scale are the cost
advantages from the growing turbine heights in the long The last part of the curve shows a situation called
run. These lower costs represent an improvement in dis-economies of scale. Turbines can grow so large,
product efficiency and can give a business a competitive resulting in high costs and higher average cost of
advantage in the market. A larger wind turbine can produce production. At that point, it becomes difficult to maintain
at a lower average cost than a smaller wind turbine.
and is causing high production costs. Manufacturers
would eventually be unable to compete against other
The calculations in Table 1 show a 3300 kW turbine with source of energies.
only fifteen units. Though it may require higher initial
expenditure, it will have a lower average cost than Larger turbines offer several benefits to developers
twenty-five 2000 kW turbines. The logic is simple.The including increased power output, lower initial capital
bigger the turbine, the more power it is able to produce requirements, and reduced maintenance and operation
with less units.
costs in comparison to wind projects of the same size
using smaller turbines (Coxworth, 2018).
CONCLUSION
In recent years, there has been a significant increase of
renewable energy use. The driver of this growth is the
steady cost decline for solar and wind technologies in
the past decade. Advancements in technology drove
down the cost of producing these technologies. With
that said, we are reaching the limit of turbine efficiency.
Developers are looking at alternatives to reduce
Figure 5 - LRAC curve for power generation production costs, such as larger turbines.
Turbine Output # of Turbine Cost BoS O&M Output TC ($) AC ($)
(kW) Turbines ($/kW) ($/kW) ($/kW) (kW)
Turbine X 2000 25 919.20 600.00 60.00 50,000 78,960,000 1579.20
Turbine Y 3300 15 1095.00 350.00 40.00 49,500 73,507,500 1485.00
Table 1 - Turbine Comparison Based on Output
32 CE INDUSTRY Journal