
Page 77 - CARILEC CE Industry Journal_Oct_2019
P. 77
Data from the Internet transforming the solar energy captured by PV array into
An online search of specific countries in the same area as AC energy delivered to utility grid. PR is defined for a
Curaçao yielded the figures shown in the table below. period of time (usually a month or a year) as the ratio of
the measured generated AC energy fed into the grid to the
potential array output DC energy under Standard Test
Conditions (STC). The calculation of monthly PR% can be
performed by the equation shown below using an
insolation value of 5.1 kWh per m2 per day (source:
Meteo Curaçao). The ηmodule used is 0.14.
Figure 14 - Performance ratio calculation
Table 8 - Specific yields of countries in the region
The table below shows the comparison of the PV
Peak Sun hours installation with the highest specific yield vs an installation
with an average specific yield. The column “Left” in the
The average daily solar insolation in units of kWh/m2 per Table 9 refers to the left graphic in Figure 15.
day is sometimes referred to as "peak sun hours". The
term "peak sun hours" refers to the solar insolation which
a particular location would receive if the sun were shining
at its maximum value for a certain number of hours.
Table 9 - Overview of two PV installations
The results of Performance ratio (PR) calculation for two
PV installations are shown graphically in the figure below
Figure 12 - Peak sun hours
The peak sun hours per day (for 2018) were 4.1 hours.
In the figure below Curaçao (the green star) lies between
the 4-5 peak sun hours band (the red circles). The
calculated 4.1 hours lies with the band.
Figure 15 - Monthly PR jan-dec 2018
Capacity factor
The capacity factor compares the actual output of a PV
array compared to the energy it would produce if it
operated at full capacity all the time. Maximum capacity
factor for a fixed PV array is around 25-28%, since the
array is unable to produce energy during the night and
even during the day only partial sunlight is available in
the early morning or in the evening. The average capacity
factor was calculated to be 17%.
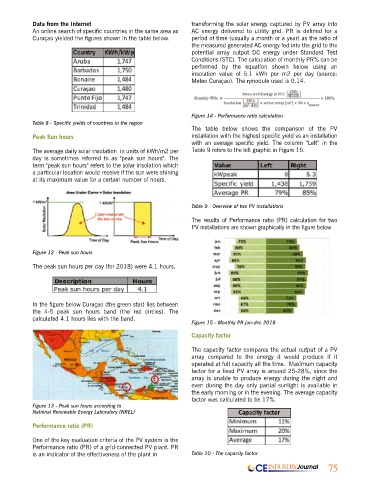
Figure 13 - Peak sun hours according to
National Renewable Energy Laboratory (NREL)
Performance ratio (PR)
One of the key evaluation criteria of the PV system is the
Performance ratio (PR) of a grid-connected PV plant. PR
is an indicator of the effectiveness of the plant in Table 10 - The capacity factor
CE INDUSTRY Journal 75