
Page 76 - CARILEC CE Industry Journal_Oct_2019
P. 76
Feed-in tariff Technical KPI’s
The regulator introduced a Feed-in tariff (FIT) in 2015 This section shows the results for the technical KPI’s.
consisting of three components:
a An feed-in energy charge of USD0.14 per PV kWh Specific yield
exported to the grid
b A consumption tariff for residential customers @ Specific yield (kWh/kWp) is one of the most commonly
USD0.34 /kWh bought used performance metrics for PV systems. It’s used for
c a capacity charge of USD4,44 per installed comparing different locations, analyzing different designs,
kWpeak and assessing the health of an array. Specific yield refers
to how much energy (kWh) is produced for every kWp of
All prices are based on price level June 2019. module capacity over the course of a year. Typical values
can range from 1,000 kWh/kWp to over 2,000
The PBT is determined at the crossing of the annual kWh/kWp, but the actual value is driven by many factors,
benefits (green) line and the combined costs line in the which include location, module selection, and balance of
figure below. In this use case with the parameters system efficiency. Refer to the table showing the calcu-
shown in Table 4 the PBT is between 7 and 8 years. lated parameters for the specific yield.
Table 7 - Specific yield parameters
The figure below shows the percentage distribution of
the specific yield calculated from the sample installa-
tions. 55% of the PV installations have a specific yield
higher than the average.
Figure 9 - Payback time graphic
Typical payback time is between 7 and 9 years.
Table 5 - Typical payback times
The average solar kWh price
On the average PV energy is between 9 and 10% lower
than energy bought from the utility.
Figure 10 - Distribution of specific yield values
for 36 PV systems in 2018
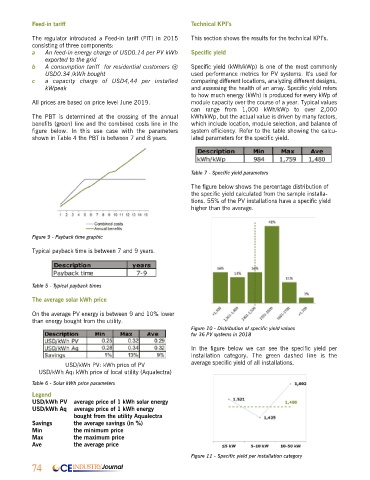
In the figure below we can see the specific yield per
installation category. The green dashed line is the
USD/kWh PV: kWh price of PV average specific yield of all installations.
USD/kWh Aq: kWh price of local utility (Aqualectra)
Table 6 - Solar kWh price parameters
Legend
USD/kWh PV average price of 1 kWh solar energy
USD/kWh Aq average price of 1 kWh energy
bought from the utility Aqualectra
Savings the average savings (in %)
Min the minimum price
Max the maximum price
Ave the average price
Figure 11 - Specific yield per installation category
74 CE INDUSTRY Journal