
Page 75 - CARILEC CE Industry Journal_Oct_2019
P. 75
Overview of Household PV installations FINDINGS AND RESULTS
This section shows the results for the PV installations on The following findings and results are presented in
the roofs of households. 620 PV installations have been several distinct sections.
registered by BT&P.
In the first section two financial KPI’s are presented:
a Payback period;
b The average solar kWh price
HH PV HH PV Next results for Technical KPI’s are presented:
installations kWp c Specific yield;
620 3,700 d Sun hours;
e
Performance ratio (PR);
f Capacity factor;
g Use usage vs total generated kW
Overview of HH installations by number Financial KPI’s
PV installations are registered by capacity as follows: This section shows the results for the financial KPI’s.
≤5 kWp installations smaller them or equal
to 5kWp Payback time
5-10 kWp installations between 5 and 10kWp
10-50kWp installations between 10 and 50kWp The payback time (PBT) is defined as the period of time
required to recover the investment of the solar array. A
Remarkable is the amount of the installations in the size model was developed to calculate the PBT. The typical
between 5 and 10kWp. We suspect that because of the solar payback period in the U.S. is between 6 and 8 years.
generous net-metering scheme a great deal of owners
saw an opportunity “to make some money” and opted to How is the solar panel payback period calculated?
install more capacity than was really needed to cover To calculate the solar panel payback period, one need to
their own daily usage. determine the combined costs and annual benefits of
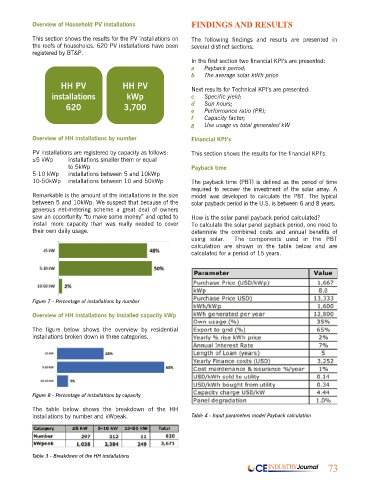
using solar. The components used in the PBT
calculation are shown in the table below and are
calculated for a period of 15 years.
Figure 7 - Percentage of installations by number
Overview of HH installations by installed capacity kWp
The figure below shows the overview by residential
installations broken down in three categories.
Figure 8 - Percentage of installations by capacity
The table below shows the breakdown of the HH
installations by number and kWpeak. Table 4 - Input parameters model Payback calculation
Table 3 - Breakdown of the HH installations
CE INDUSTRY Journal 73