
Page 18 - CARILEC Electric Tariff Report - March 2022
P. 18
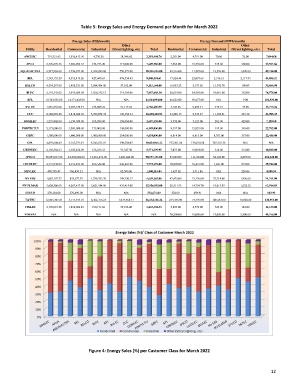
Table 5: Energy Sales and Energy Demand per Month for March 2022

                               Energy Sales (US$/month)                              Energy Demand (MWh/month)
                                                    Other                                             Other
            Utility   Residential   Commercial   Industrial   (Street lighting, etc)   Total   Residential   Commercial   Industrial   (Street lighting, etc)   Total
           ANGLEC    719,333.65   1,556,411.99   4,770.50   38,948.62   2,319,464.76   2,183.00   4,719.00   70.00   72.00   7,044.00
            APUA    2,496,870.46   4,882,982.34   152,733.20   117,000.00   7,649,586.00   7,563.00   15,339.00   435.66   260.00   23,597.66
         AQUALECTRA   8,547,969.00   4,756,077.00   4,342,893.00   558,577.00   18,205,516.00   22,316.00   11,525.00   13,523.00   1,820.00   49,184.00
            BEL     3,383,155.29   4,553,415.26   427,449.63   476,534.43   8,840,554.61   17,624.44   22,037.63   2,316.21   2,117.93   44,096.21
            BELCO   4,534,257.00   1,458,331.00   3,084,904.00   37,652.00   9,115,144.00   16,953.23   5,137.02   13,392.70   198.03   35,680.98
            BLPC    2,719,143.02   3,493,609.09   1,560,752.13   114,184.06   7,887,688.30   28,601.00   29,558.00   18,067.00   352.00   76,578.00
             BPL    10,743,556.00   14,171,438.00   N/A   N/A   24,914,994.00   46,823.00   59,677.00   N/A   9.00   106,509.00
            BVI EC   1,546,354.08   3,027,133.47   153,885.22   31,117.22   4,758,489.99   4,187.96   9,035.41   473.91   75.98   13,773.26
            CUC     8,302,903.46   3,818,046.39   3,789,874.74   149,394.33   16,060,218.93   23,282.15   9,935.27   11,304.61   463.32   44,985.35
           DOMLEC   1,235,842.00   1,150,039.00   103,289.00   158,068.00   2,647,238.00   3,358.00   3,125.00   281.00   429.00   7,193.00
          FORTIS TCI   2,375,000.00   3,509,000.00   175,000.00   130,000.00   6,189,000.00   8,597.00   12,821.00   919.00   365.00   22,702.00
            GBPC    1,300,000.00   1,600,000.00   1,500,000.00   254,000.00   4,654,000.00   6,814.00   6,615.00   8,703.00   357.00   22,489.00
            GPL     4,592,604.43   2,167,731.91   3,743,871.81   330,758.07   10,834,966.22   222,301.54   139,010.58   707,267.78   N/A   N/A
           GRENLEC   2,136,564.63   3,385,254.29   156,233.53   93,347.50   5,771,399.95   7,075.00   10,018.00   614.00   312.00   18,019.00
            JPSCO   38,053,917.00   43,232,084.00   15,961,471.00   1,289,684.00   98,537,156.00   87,625.00   111,634.00   54,168.00   2,895.00   256,322.00
           LUCELEC   2,531,938.00   4,553,493.00   450,542.00   236,405.00   7,772,378.00   10,809.00   16,451.00   1,647.00   839.00   29,746.00
           NEVLEC    490,795.47   766,830.31   N/A   82,590.06   1,340,215.84   1,627.02   2,711.86   N/A   250.06   4,588.94
            NV EBS   1,882,192.77   828,677.97   1,799,282.20   149,230.12   4,659,383.06   47,425.00   13,126.00   32,214.00   1,996.00   94,761.00
          NV ELMAR   5,628,506.00   4,267,437.00   5,621,544.00   439,415.00   15,956,902.00   28,311.93   14,754.70   19,615.89   1,232.32   63,914.83
            STUCO    278,184.00   276,490.00   N/A   N/A       554,674.00   524.00   459.91   N/A      N/A       983.90
            T&TEC   12,025,407.81   4,771,914.01   8,362,376.25   1,074,468.17   26,234,166.24   253,446.00   74,395.00   300,242.00   10,828.00   638,911.00
           VINLEC   2,176,067.38   1,838,086.49   190,171.66   59,106.80   4,263,432.33   5,893.00   4,573.00   545.00   142.00   11,153.00
           VIWAPA      N/A      N/A      N/A         N/A        N/A     20,300.00   10,000.00   13,000.00   5,800.00   49,100.00


                                      Figure 4: Energy Sales (%) per Customer Class for March 2022


                                                                                                                  12