
Page 19 - CARILEC Tariff Report Dec 2023
P. 19
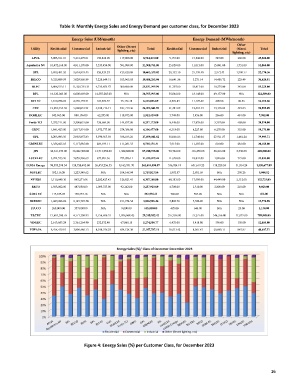
Table 9: Monthly Energy Sales and Energy Demand per customer class, for December 2023

                               Energy Sales (US$/month)                           Energy Demand (MWh/month)
                                                                                                    Other
                                                  Other (Street
              Utility   Residential   Commercial   Industrial   Total   Residential   Commercial   Industrial   (Street   Total
                                                  lighting, etc)
                                                                                                  lighting, etc)
              APUA    3,003,911.01   5,412,479.01   190,828.98   117,000.00   8,724,219.00   9,153.00   15,846.00   545.00   260.00   25,804.00
            Aqualectra NV   10,472,168.00   4,911,170.00   5,333,454.00   591,989.00   21,308,781.00   25,029.00   11,013.00   15,091.00   1,731.00   52,864.00
               BEL    3,890,401.20   5,616,893.45   526,424.29   429,620.08   10,463,339.02   20,132.70   27,159.48   2,972.41   1,909.77   52,174.36
              BELCO   9,325,809.59   3,029,860.89   7,228,649.51   103,965.05   19,688,285.04   16,641.56   5,271.14   14,486.72   225.49   36,624.91
              BLPC    8,808,513.11   11,329,733.33   4,733,853.57   309,899.98   25,181,999.99   31,755.00   33,817.00   19,275.00   381.00   85,228.00
               BPL    16,320,043.00   6,000,669.00   14,387,285.00   N/A   36,707,997.00   55,064.00   18,148.00   49,177.00   N/A   122,389.00
              BVI EC   1,810,958.98   4,220,157.71   143,853.22   35,126.18   6,210,096.09   4,576.83   11,192.49   408.98   80.56   16,258.86
               CUC    13,095,554.58   5,680,051.94   5,938,716.11   187,719.36   24,902,041.99   31,487.69   12,601.54   14,316.03   449.83   58,855.09
             DOMLEC    842,963.00   888,196.00   62,295.00   118,975.00   1,912,429.00   3,749.00   3,456.00   266.00   491.00   7,962.00
             Fortis TCI   2,325,711.00   3,508,031.00   238,604.00   144,827.00   6,217,173.00   8,448.00   12,829.00   3,292.00   405.00   24,974.00
              GBPC    1,841,423.00   2,017,891.00   1,972,777.00   274,386.00   6,106,477.00   6,318.00   6,227.00   6,270.00   355.00   19,170.00
               GPL    8,205,983.50   2,983,857.83   5,970,567.03   338,633.26   17,499,041.62   38,866.86   11,740.04   27,911.57   1,481.24   79,999.71
             GRENLEC   3,356,605.05   5,117,885.60   209,399.11   111,281.55   8,795,171.31   7,915.00   11,387.00   603.00   283.00   20,188.00
               JPS    34,341,939.00   38,482,908.00   13,713,058.00   1,382,860.00   87,920,765.00   90,764.00   116,470.00   58,416.00   3,330.00   268,980.00
             LUCELEC   3,924,573.26   7,059,568.69   677,981.36   272,956.11   11,935,079.42   11,628.00   18,841.00   1,846.00   715.00   33,030.00
            LUMA Energy   98,075,298.54   128,720,492.08   26,455,256.55   9,163,951.70   262,414,998.87   536,924.19   651,619.22   138,220.24   31,914.24   1,358,677.89
             NEVLEC    392,116.20   1,223,549.62   N/A   104,148.04   1,719,813.86   1,992.57   2,801.69   N/A   250.26   5,044.52
              NV EBS   3,110,640.30   867,271.66   2,202,427.43   126,821.41   6,307,160.80   68,183.00   17,989.00   44,449.00   2,112.00   132,733.00
              RECO    1,563,002.00   487,058.00   1,095,727.00   92,142.00   3,237,929.00   4,700.00   1,310.00   2,800.00   210.00   9,020.00
             SABA EC   112,675.03   140,323.18   N/A   N/A   252,998.21   308.00   384.00   N/A      N/A      692.00
              SKELEC   1,449,426.22   2,145,725.50   N/A   211,754.54   3,806,906.26   5,828.72   7,946.26   N/A   N/A   13,774.98
              STUCO    269,000.00   357,000.00   N/A   9,000.00   635,000.00   485.00   646.00   N/A   23.00   1,154.00
              T&TEC   13,693,380.76   4,771,106.93   9,756,696.31   1,096,868.42   29,318,052.42   277,036.00   75,277.00   346,556.00   11,019.00   709,888.00
              VINLEC   2,613,603.24   2,361,264.90   232,572.48   67,060.15   5,274,500.77   6,433.00   5,418.00   596.00   158.00   12,605.00
             VIWAPA   8,474,419.91   3,890,486.73   8,938,756.25   654,124.30   21,957,787.19   19,513.42   8,087.45   20,050.77   845.87   48,497.51


                                    Figure 4: Energy Sales (%) per Customer Class, for December 2023


                                                                                                                  16