
Page 17 - Annual Report 2017
P. 17
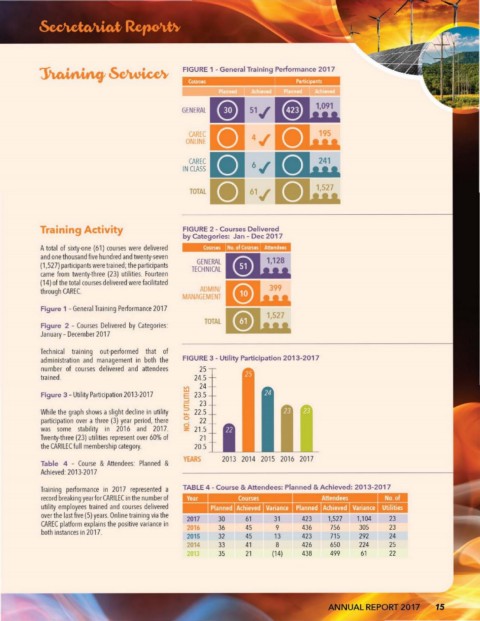
FIGURE 1 - General Training Performance 2017


                                                                 5'./
                                                GENERAL

                                                 CAREC           4./
                                                 ONLINE

                                                 CAREC
                                                IN CLASS         6./


                                                 TOTAl           6'./


           Training Ac:tivity                   FIGURE 2 - Courses Delivcred
                                                by Categories:  Jan - Dec 2017
           A total  of sixty-one (61) <ourses  were  delivered   Cour:;,~  No  of Cour:;,:;   AtI.n6"~
           and one thousand live hundred and lWenly.seven
                                                   GENERAl
           (1,527) participants were traine<!; the participants   TECHNICAl
           Glme  !rom  twenty-three  (23)  utilities. Fourteen
           (14) of the tolal courses delivered were farilitated
           through (AREC.                           ADMINI
                                                MANAGEMENT
           Figure 1 - General Training Performance 201 7
                                                     TOTAl
           Figure  2 - Courses  Delivered  by  Categories:
           January - December 2017

           Technital  training  out-perlormed  tha!  of
           administration  and  management  in  both  the   FIGURE 3 - Utility Participation 2013·2017
           number  of  (Ourses  delivered  and  attendees   25
           trained.                                24.5
            Rgure 3 - Utility Participation 20H2017

           White the graph shows il slight decline in utility
           participation  over a three (3) year  pefiod, there
           was  sorne  stability  in  2016  and  2017.
           Twenty-three (23) ulilities represent over 60% of
           the CARllEC full membership category.
                                                YEARS     2013  2014  2015  2016  2017
           Table  4  - Course  & Attendees:  Planned  &
           h:.hieved: 2013-2017

           Training  performance  in  2017  represented  a   TABLE 4 . Course & Attcndces: Planned & Achieved: 2013-2017
            record breaking year forCARllEC in the numberof   Courses              Attendees
            ulility employees trained  and  courses  delivered
           over the last live (5) years. Online training via the
                                                 2017    30     61     31            1,527   1,104   23
            CAREC platform eKplains the positive variance in   2016   36   45   9   436   756   305   23
            both instances in 2017.
                                                 2015    32     45     13     423    715     292     24
                                                 2014    33     41     6      426    650     224     25
                                                         35     21     114)   436    499     61      22


                                                                                      NNIUAL REPORT 2fM1        1S