
Page 19 - Annual Report 2017
P. 19
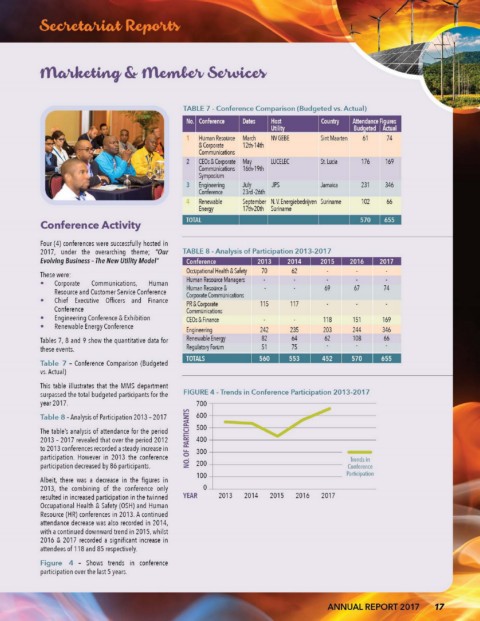
TABLE 7 - Conference Comparison (Budgeted vs. Actual)
                                                                      Host                 Attendance Figures
                                                                      Utill                8ud  eted  Actual
                                                    Human Resource   March   NVGEBE   Sint Maarten   61   74
                                                    & Corporate   12th-14th
                                                    Communications
                                                 2   CEOs & Corporate   M'h   LUCELEe   St. Lucia   176   169
                                                    Communications  16t  ·19th
                                                    Symposium
                                                3   Engineering   July   JPS       Jamaica   231   346
                                                    Conference   23rd ·26th
                                                 4   Renewable   September  N. V. Energiebedrijven  Suriname   102   66
                                                    Energy     17th-2Oth  Suriname
                                                 TOTAL
           Conference Activity
           Four (4) conferences were su(cessfully hosted  in
           2017,  under  the  overarching  theme;  "Our   TABLE 8 - Analysis of Participation 2013-2017
           Evolving Business - The New Utility Model"   Conference   .4.'@ •• 4·'I··4.' .... 4." •• 4.'.
                                                 Occupational Health & Saf,ty   70   62
           These were:
           •   Corporate   Communications,   Human   Human Re$Ource Managers
                                                 Human Re$Ource&                    69     67      74
               Resource and Customer Service Conference
                                                 Corporate Comm u nications
           •   Chief  Executive  Officers  and  Finance
                                                 PR & Corporet,    115     117
               Conference                        Communications
           •   Engineering Conference & Exhibition   CEOs & Finance                 118    151     169
           •   Renewable Energy Conference
                                                 Engineering       242     235      203    244     346
           Tables 7, 8 and  9 show the quantitative  data for   Renewable Energy   82   64   62   108   66
           these events.                         Regulatory Forum   51     75
                                                 TOTAlS
           Table  7  - Conference  Comparison  (Budgeted
           vs. Actual)
           This  table illustrates  that the  MMS  department
           surpassed  the total  budgeted  participants for the   FIGURE 4 - Trends in Conference Participation 2013-2017
           year 2017.                              700 ,--------------------------------
                                                ....
                                                V>                               /
           Table 8 - Analysis of Participation 2013 - 2017   z   600
                                                11:                        ~
           The table's analysis of attendance for the  period   Ci   500   ~
           2013 - 2017  revealed that over the  period 2012   ~   400
           to 2013 conferences recorded a steady increase in   11:
                                                ~   300
           participation.  However in  2013  the  conference   0
                                                d   200                                   Trends in
           participation decreased by 86 participants.   z                                Conference
                                                   100                                   Participation
           Albeit,  there was  a decrease  in  the  figures  in
           2013,  the  combining  of  the  conference  only   0
           resulted in increased participation in the twi nned   YEAR   2013   2014   2015   2016   2017
           Occupational  Health  & Safety (OSH) and  Human
           Resource {HR} conferences in 2013. A continued
           attendance  decrease  was also  recorded  in 2014,
           with a continued downward trend  in 2015, whilst
           2016  & 2017  recorded  a significant increase in
           attendees of 118 and 85 respectively.
           Figure  4  - Shows  trends  in  conference
           participation over the  la st 5 years.


                                                                                     ANNUAL REPORT 2017         17