
Page 54 - CARILEC CE Industry Journal_Oct_2019
P. 54
NEW TECHNOLOGY The above signature, although not familiar to you, is
very easy to interpret. Either the valves open and close
“when” they are supposed to and with an amplitude like
With the help of advanced software, more detailed the other cylinders or they don’t. When the don’t, that
measures are available to an engineer responsible for the indicates a difference or change. If the injector does not
safe and economical operation of an engine. Statistical pop when expected, normal combustion cannot be
analysis, such as standard deviation or the measure of expected. Further when unexpected mechanical impacts
how consistent a cylinder fires, is a key measure of fuel occur where none are expected, that also indicates an
delivery to the cylinder. For example, a standard issue. As the data is crank-referenced, the likelihood of
deviation that is too high would indicate inconsistent identifying the failed component is greatly increased.
fuel delivery. Another measure of importance is the first
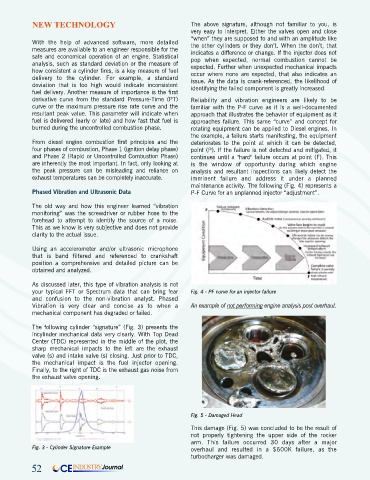
derivative curve from the standard Pressure-Time (PT) Reliability and vibration engineers are likely to be
curve or the maximum pressure rise rate curve and the familiar with the P-F curve as it is a well-documented
resultant peak value. This parameter will indicate when approach that illustrates the behavior of equipment as it
fuel is delivered (early or late) and how fast that fuel is approaches failure. This same “curve” and concept for
burned during the uncontrolled combustion phase. rotating equipment can be applied to Diesel engines. In
the example, a failure starts manifesting, the equipment
From diesel engine combustion first principles and the deteriorates to the point at which it can be detected,
four phases of combustion, Phase 1 (ignition delay phase) point (P). If the failure is not detected and mitigated, it
and Phase 2 (Rapid or Uncontrolled Combustion Phase) continues until a "hard" failure occurs at point (F). This
are inherently the most important. In fact, only looking at is the window of opportunity during which engine
the peak pressure can be misleading and reliance on analysis and resultant inspections can likely detect the
exhaust temperatures can be completely inaccurate. imminent failure and address it under a planned
maintenance activity. The following (Fig. 4) represents a
Phased Vibration and Ultrasonic Data P-F Curve for an unplanned injector “adjustment”.
The old way and how this engineer learned “vibration
monitoring” was the screwdriver or rubber hose to the
forehead to attempt to identify the source of a noise.
This as we know is very subjective and does not provide
clarity to the actual issue.
Using an accelerometer and/or ultrasonic microphone
that is band filtered and referenced to crankshaft
position a comprehensive and detailed picture can be
obtained and analyzed.
As discussed later, this type of vibration analysis is not
your typical FFT or Spectrum data that can bring fear Fig. 4 - PF curve for an injector failure
and confusion to the non-vibration analyst. Phased
Vibration is very clear and concise as to when a An example of not performing engine analysis post overhaul.
mechanical component has degraded or failed.
The following cylinder “signature” (Fig. 3) presents the
incylinder mechanical data very clearly. With Top Dead
Center (TDC) represented in the middle of the plot, the
sharp mechanical impacts to the left are the exhaust
valve (s) and intake valve (s) closing. Just prior to TDC,
the mechanical impact is the fuel injector opening.
Finally, to the right of TDC is the exhaust gas noise from
the exhaust valve opening.
Fig. 5 - Damaged Head
This damage (Fig. 5) was concluded to be the result of
not properly tightening the upper side of the rocker
arm. This failure occurred 30 days after a major
Fig. 3 - Cylinder Signature Example overhaul and resulted in a $600K failure, as the
turbocharger was damaged.
52 CE INDUSTRY Journal