Page 56 - CARILEC CE Industry Journal_Oct_2019
P. 56

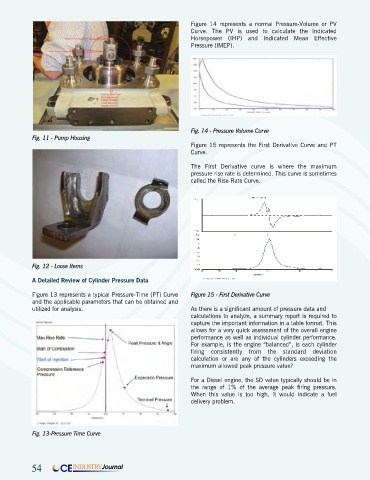
Figure  14  represents  a  normal  Pressure-Volume  or  PV
                                                                Curve.  The  PV  is  used  to  calculate  the  Indicated
                                                                Horsepower (IHP) and Indicated Mean Effective
                                                                Pressure (IMEP).


                                                                Fig. 14 - Pressure Volume Curve
            Fig. 11 - Pump Housing
                                                                Figure 15 represents the First Derivative Curve and PT
                                                                Curve.

                                                                The First Derivative curve is where the maximum
                                                                pressure rise rate is determined. This curve is sometimes
                                                                called the Rise-Rate Curve.


            Fig. 12 - Loose Items

            A Detailed Review of Cylinder Pressure Data

            Figure 13 represents a typical Pressure-Time (PT) Curve   Figure 15 - First Derivative Curve
            and the applicable parameters that can be obtained and
            utilized for analysis.                              As there is a significant amount of pressure data and
                                                                calculations to analyze, a summary report is required to
                                                                capture the important information in a table format. This
                                                                allows for a very quick assessment of the overall engine
                                                                performance as well as individual cylinder performance.
                                                                For example, is the engine “balanced”, is each cylinder
                                                                firing consistently from the standard deviation
                                                                calculation or are any of the cylinders exceeding the
                                                                maximum allowed peak pressure value?

                                                                For a Diesel engine, the SD value typically should be in
                                                                the  range  of  1%  of  the  average  peak  firing  pressure.
                                                                When this value is too high, it would indicate a fuel
                                                                delivery problem.


            Fig. 13-Pressure Time Curve


            54       CE  INDUSTRY Journal
   51   52   53   54   55   56   57   58   59   60   61