
Page 58 - CARILEC CE Industry Journal_Oct_2019
P. 58
Once proper data collection is complete, the data will
allow the engineer to identify normal behavior and
abnormal behavior. Examples include, but are not
limited to, the following:
• The condition of the intake and exhaust valves
and/or ports
• The timing for all valve and port-related events
• The condition of the fuel injector
• The condition of the rings and cylinder surfaces
• If piston slap is indicated
• The identity of all external leaks
• If bearings, pins and bushings indicate impacting
In Figure 20, an example is shown of a complete
cylinder signature with different locations and frequency
ranges:
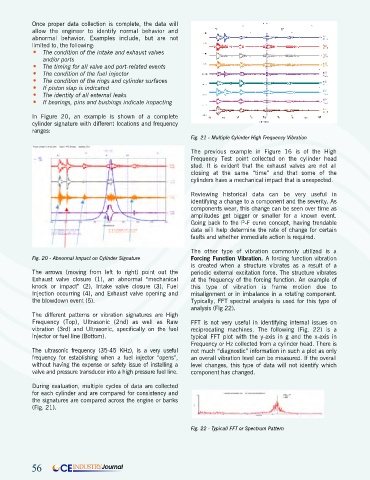
Fig. 21 - Multiple Cylinder High Frequency Vibration
The previous example in Figure 16 is of the High
Frequency Test point collected on the cylinder head
stud. It is evident that the exhaust valves are not all
closing at the same “time” and that some of the
cylinders have a mechanical impact that is unexpected.
Reviewing historical data can be very useful in
identifying a change to a component and the severity. As
components wear, this change can be seen over time as
amplitudes get bigger or smaller for a known event.
Going back to the P-F curve concept, having trendable
data will help determine the rate of change for certain
faults and whether immediate action is required.
The other type of vibration commonly utilized is a
Fig. 20 - Abnormal Impact on Cylinder Signature Forcing Function Vibration. A forcing function vibration
is created when a structure vibrates as a result of a
The arrows (moving from left to right) point out the periodic external excitation force. The structure vibrates
Exhaust valve closure (1), an abnormal “mechanical at the frequency of the forcing function. An example of
knock or impact” (2), Intake valve closure (3), Fuel this type of vibration is frame motion due to
Injection occurring (4), and Exhaust valve opening and misalignment or in imbalance in a rotating component.
the blowdown event (5). Typically, FFT spectral analysis is used for this type of
analysis (Fig 22).
The different patterns or vibration signatures are High
Frequency (Top), Ultrasonic (2nd) as well as Raw FFT is not very useful in identifying internal issues on
vibration (3rd) and Ultrasonic, specifically on the fuel reciprocating machines. The following (Fig. 22) is a
injector or fuel line (Bottom). typical FFT plot with the y-axis in g and the x-axis in
Frequency or Hz collected from a cylinder head. There is
The ultrasonic frequency (35-45 KHz), is a very useful not much “diagnostic” information in such a plot as only
frequency for establishing when a fuel injector “opens”, an overall vibration level can be measured. If the overall
without having the expense or safety issue of installing a level changes, this type of data will not identify which
valve and pressure transducer into a high pressure fuel line. component has changed.
During evaluation, multiple cycles of data are collected
for each cylinder and are compared for consistency and
the signatures are compared across the engine or banks
(Fig. 21).
Fig. 22 - Typicall FFT or Spectrum Pattern
56 CE INDUSTRY Journal