
Page 59 - CARILEC CE Industry Journal_Oct_2019
P. 59
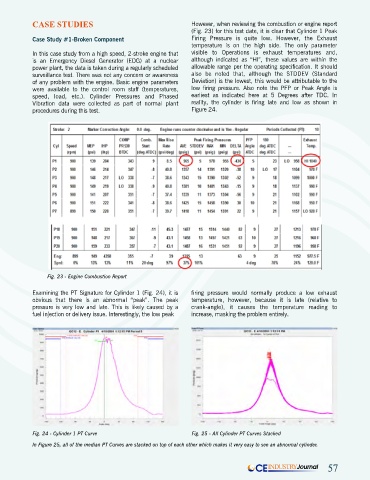
CASE STUDIES                                        However, when reviewing the combustion or engine report
                                                                (Fig. 23) for this test date, it is clear that Cylinder 1 Peak
            Case Study #1-Broken Component                      Firing Pressure is quite low. However, the Exhaust
                                                                temperature is on the high side. The only parameter
            In this case study from a high speed, 2-stroke engine that   visible to Operations is exhaust temperatures and,
            is an Emergency Diesel Generator (EDG) at a nuclear   although indicated as “HI”, these values are within the
            power plant, the data is taken during a regularly scheduled   allowable range per the operating specification. It should
            surveillance test. There was not any concern or awareness   also be noted that, although the STDDEV (Standard
            of any problem with the engine. Basic engine parameters   Deviation) is the lowest, this would be attributable to the
            were available to the control room staff (temperatures,   low firing pressure. Also note the PFP or Peak Angle is
            speed, load, etc.). Cylinder Pressures and Phased   earliest as indicated here at 5 Degrees after TDC. In
            Vibration data were collected as part of normal plant   reality, the cylinder is firing late and low as shown in
            procedures during this test.                        Figure 24.


                 Fig. 23 - Engine Combustion Report


            Examining the PT Signature for Cylinder 1 (Fig. 24), it is   firing pressure would normally produce a low exhaust
            obvious that there is an abnormal “peak”. The peak   temperature, however, because it is late (relative to
            pressure is very low and late. This is likely caused by a   crank-angle), it causes the temperature reading to
            fuel injection or delivery issue. Interestingly, the low peak   increase, masking the problem entirely.


            Fig. 24 - Cylinder 1 PT Curve                       Fig. 25 - All Cylinder PT Curves Stacked
            In Figure 25, all of the median PT Curves are stacked on top of each other which makes it very easy to see an abnormal cylinder.


                                                                                      CE  INDUSTRY Journal   57