
Page 14 - CE JOURNAL FEB 2024 ISSUE 20
P. 14
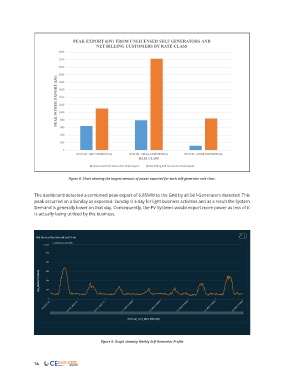
Figure 8. Chart showing the largest amount of power exported for each self-generator rate class.


               The dashboard detected a combined peak export of 6.85MW to the Grid by all Self-Generators detected. This
               peak occurred on a Sunday as expected. Sunday is a day for light business activities and as a result the System
               Demand is generally lower on that day. Consequently, the PV Systems would export more power as less of it
               is actually being utilized by the business.


                                           Figure 9. Graph showing Weekly Self-Generator Profile


               14