
Page 15 - CE JOURNAL FEB 2024 ISSUE 20
P. 15
METHODOLOGY
The smart meters on the Grid can measure Power Delivered and Power Received on independent measuring
channels. For example, if a meter delivers 12kWh and receives 5kWh (export) to the grid, the values can be
seen independently. This attribute is one of the key characteristics that enables the dashboard to perform
some of the analysis it does.
To determine the Net Billing Customers, the dashboard performs a query on the account set up type, using
the Data that would have been imported from the Customer Relationship Management tool. Next, it uses
the Meter Number associated with those customers to perform a query on the AMI network to get the kWh
delivered (energy used by customer now referred to as kWh) and kWh received (energy export now referred
to as kWhe) readings. It then calculates the kW from those readings for use in other analysis. A check is done
to see if the kWhe is greater than zero (0) and if the kWh is equal to zero (0). This is done to detect any inverted
meters and put them aside. A similar set of steps is done to determine Auxiliary Connections however a further
step is done to detect if there are any Auxiliary Connections in breach. To do this, a check is conducted to
see if the kWhe channel has any value greater than zero (0). This would imply that this Auxiliary Connection
is exporting power and as such is acting in breach of the contract.
We determine which are Unlicensed Self Generator Customers by doing a check on all meters in the AMI
network that have a value greater than zero (0) on the kWhe channel and whose account set up type is not a
Net Billing Customer. The inverted meter filter would have been applied here so that they are not included in
this number. It is important to note that Unlicensed Self-Generators who are generating just enough power
or less for themselves would not be reflected in this list as they would not be generating enough for them to
get detected by the Smart Meters.
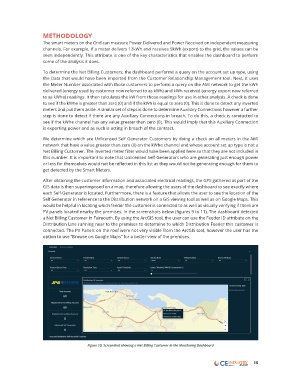
After obtaining the customer information and associated electrical readings, the GPS gathered as part of the
GIS data is then superimposed on a map, therefore allowing the users of the dashboard to see exactly where
each Self-Generator is located. Furthermore, there is a feature that allows the user to see the location of the
Self Generator in reference to the Distribution network on a GIS viewing tool as well as on Google Maps. This
would be helpful in locating which feeder the customer is connected to as well as visually verifying if there are
PV panels located nearby the premises. In the screenshots below (figures 9 to 11), The dashboard detected
a Net Billing Customer in Falmouth. By using the ArcGIS tool, the user can use the Feeder ID attribute on the
Distribution Line running near to the premises to determine to which Distribution Feeder this customer is
connected. The PV Panels on the roof were not very visible from the ArcGIS tool, however the user has the
option to use “Browse on Google Maps” for a better view of the premises.
Figure 10. Screenshot showing a Net Billing Customer in the Monitoring Dashboard
15