
Page 12 - CE JOURNAL FEB 2024 ISSUE 20
P. 12
In order to present the data meaningfully, there are a number of charting tools used to make the data easily
understandable. The dashboard also comes with a series of filters that allows analysis on a more granular
level. Some of these filters include but are not limited to the:
1. Time Frame or period of analysis
2. Service Rate Code, for example whether the Customer is a Residential,
Small Commercial or Large Commercial,
3. Service Parish
4. Account Set Up Type (Net Billing Customer, Auxiliary Connection, Unlicensed Self Generators)
Figure 4. Screenshot showing the Demand Analysis page of the Self-Generator dashboard.
RESULTS
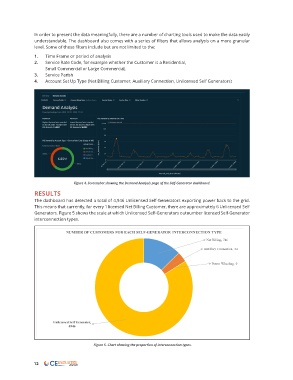
The dashboard has detected a total of 4,946 Unlicensed Self-Generators exporting power back to the grid.
This means that currently, for every 1 licensed Net Billing Customer, there are approximately 6 Unlicensed Self
Generators. Figure 5 shows the scale at which Unlicensed Self-Generators outnumber licensed Self-Generator
interconnection types.
Figure 5. Chart showing the proportion of interconnection types.
12