
Page 26 - CE_Industral_Journal_2015
P. 26
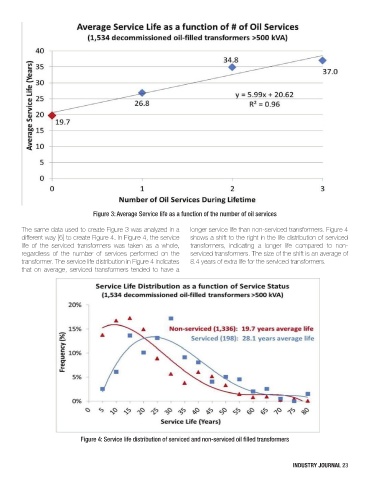
Figure 3: Average Service life as a function of the number of oil services

        The same data used to create Figure 3 was analyzed in a   longer service life than non-serviced transformers. Figure 4
        different way [6] to create Figure 4. In Figure 4, the service   shows a shift to the right in the life distribution of serviced
        life  of  the  serviced  transformers  was  taken  as  a  whole,   transformers,  indicating  a  longer  life  compared  to  non-
        regardless  of  the  number  of  services  performed  on  the   serviced transformers. The size of the shift is an average of
        transformer. The service life distribution in Figure 4 indicates   8.4 years of extra life for the serviced transformers.
        that on average, serviced transformers tended to have a


                            Figure 4: Service life distribution of serviced and non-serviced oil filled transformers


                                                                                                  industry Journal 23